How to Check Heap Memory Usage of process in Linux
Heap memory is a region where a program can dynamically allocate and deallocate memory during runtime.
Unlike stack memory, heap allocation is manual, requiring explicit requests and releases.
It’s used for data structures with varying sizes or lifetimes, but careful management is essential to prevent memory leaks.
The below methods help you to determine Heap Memory consumption for Linux Processes:
- Inspecting
/proc/<PID>/maps. - Using
toporhtop. - Leveraging
valgrind. - Custom Instrumentation.
Solutions to Check Heap Memory Usage of Process in Linux
Let’s go through this guide to learn more about Heap Memory and estimate its usage.
Consider directly determining the exact heap memory usage of a process in Linux can be challenging due to the dynamic nature of the heap and the kernel’s memory management.
Method 1: Inspecting /proc/<PID>/maps
Using this method helps you to have a snapshot of the process’s memory map, including heap regions.
Since it offers a static view, might not reflect real-time heap usage, and requires manual calculations.
pid=$(pidof your_process)
cat /proc/$pid/maps | grep "[heap]" | awk '{ sum += $2 - $1 } END { print sum }'
Let’s break down the above example of monitor heap memory Linux:
pidof your_process: Gets the process ID (PID) of the target process.cat /proc/$pid/maps: Displays the memory map of the process.grep "[heap]": Filters lines related to heap memory regions.awk '{ sum += $2 - $1 } END { print sum }': Calculates the total size of heap regions by summing the difference between start and end addresses.
Method 2: Using top or htop
This method provides a dynamic view of overall process memory usage. While it doesn’t specifically show heap usage, can help identify memory-related issues.
topOR
htopTo use this solution, consider:
- Press
hfor help, then f to add columns. - Add columns like
RES(resident memory size),VIRT(virtual memory size), and%MEM(percentage of memory used). - Monitor the memory usage of your process over time.
Method 3: Leveraging valgrind
This method is used for detailed heap profiling, memory leak detection, and performance analysis.
When using this solution, consider that it adds overhead to the program’s execution.
valgrind --tool=massif your_programLet’s break down the above command to check heap memory Linux:
valgrindis a powerful tool for memory debugging and profiling.--tool=massifenables heap profiling.massifgenerates output files that can be analyzed usingms_printorkcachegrind.
Method 4: Custom Instrumentation
This method helps you to precise heap measurement within your application.
Using this solution might impact performance and require code modifications.
To use this method, use libraries like malloc_count, or implement custom logic to track memory allocations and deallocations.
That’s it! By combining the explained methods and considering the limitations, you can gain insights into your process’s heap memory behavior.
By Linux heap memory analysis, the server can handle more connections efficiently and maintain responsiveness.
How does Heap Memory Work?
The heap is a region of memory where a process dynamically allocates and deallocates storage as needed.
Unlike the stack, which follows a LIFO (Last In, First Out) structure, the heap is more flexible, allowing for arbitrary allocation and deallocation patterns.
When a program requests memory from the heap using functions like malloc or calloc, the operating system typically handles the allocation process.
The system maintains a data structure, often called a free list, to track available memory blocks.
Upon receiving a request, the system searches the free list for a suitable block and allocates it to the process. If no sufficiently large block is found, the system may request additional memory from the kernel using system calls like sbrk or mmap.
Heap Management
Programmers are responsible for managing heap memory effectively.
Key functions for heap management include:
malloc(): Allocates a block of memory of a specified size and returns a pointer to it.calloc(): Allocates a block of memory, initializes it to zero, and returns a pointer to it.realloc(): Resizes an already allocated block of memory.free(): Deallocates a previously allocated block of memory, returning it to the heap.
Best Practices for Heap Memory Management
- Allocate only the necessary memory.
- Deallocate memory promptly when no longer needed.
- Use smart pointers or garbage collection where available.
- Avoid excessive memory allocations and deallocations.
- Profile heap usage to identify performance bottlenecks.
To effectively manage heap memory and optimize your application’s performance, consider a powerful Linux VPS.
Heap Memory Allocation and Deallocation
Heap Memory Allocation
Heap memory allocation is the process of requesting a block of memory from the heap for your program’s use. This is done dynamically, meaning the size of the memory block is not determined until runtime.
Heap Memory Deallocation
Heap memory deallocation is the process of returning a previously allocated block of memory back to the heap for reuse. This is crucial to prevent memory leaks.
How to Use malloc and free to allocation and deallocation Heap Memory
malloc allocates a block of memory on the heap and returns a pointer to it. free deallocates previously allocated memory, returning it to the heap.
Here is an example of Memory Allocation and Deallocation:
#include <stdio.h>
#include <stdlib.h>

int main() {
    int *ptr = (int*)malloc(sizeof(int)); // Allocate memory
    *ptr = 42;
    printf("Value: %d\n", *ptr);
    free(ptr); // Deallocate memory
    return 0;
}
Is Heap Memory a Special kind of memory?
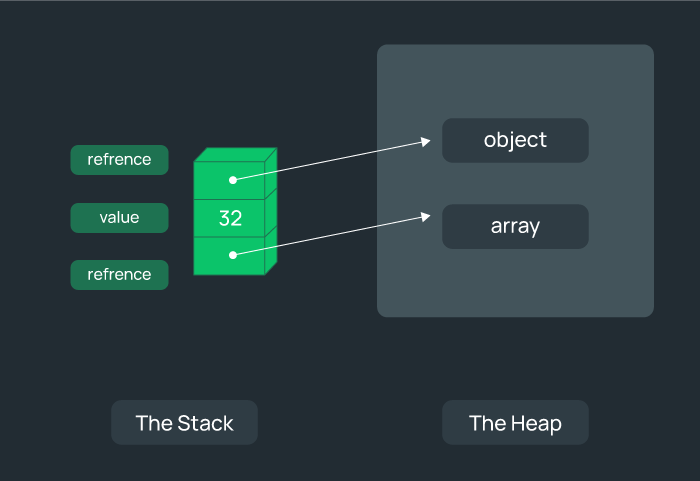
Heap vs. Stack
While the stack follows a LIFO structure, the heap offers flexible memory allocation for Linux processes.
To better understand the heap, it’s helpful to contrast it with the stack:
| Feature | Heap | Stack |
|---|---|---|
| Allocation | Dynamic | Automatic |
| Growth Direction | Upwards | Downwards |
| Access | Slower | Faster |
| Management | Manual | Automatic |
| Error Prone | More prone to errors (memory leaks, buffer overflows) | Less prone to errors |
Differences between Heap and Stack is shown in the below diagram:
Heap vs. Virtual Memory
The /proc/<PID>/maps file shows virtual memory addresses. While the heap resides within virtual memory, the actual physical memory used might be less.
The kernel employs techniques like demand paging, where physical memory is only allocated when a virtual page is accessed for the first time.
Tools for Monitoring Heap Usage over Time
Here are Linux heap memory tools:
perf
This powerful performance analysis tool can be used to track heap allocations and deallocations over time.
It provides detailed statistics like the number of allocations, size distribution, and allocation call stacks.
cachegrind
This tool, part of the Valgrind suite, can be used to analyze heap usage patterns in more detail.
It provides visualizations of memory allocation and deallocation events, helping to identify potential memory leaks or excessive allocations.
What is the Importance of Heap Memory?
Understanding Linux heap memory usage is crucial for developers as it directly impacts application efficiency, stability, and resource utilization.
Proper heap management can prevent memory leaks, improve performance, and enhance overall system reliability
How to Optimize Heap Usage?
To optimize heap memory Linux, consider:
- Allocate memory in appropriate chunks:
Avoid excessively small or large allocations. Consider the size of the data you need to store and allocate accordingly.
- Reuse memory whenever possible:
If you know you will need a specific amount of memory multiple times, consider allocating it once and reusing it instead of making repeated allocations and deallocations.
- Use smart pointers:
Smart pointers in C++ (like unique_ptr, shared_ptr) automatically manage memory deallocation, reducing the risk of memory leaks.
What are the Common Issues related to Heap Memory management Linux?
To diagnose heap memory issues, get familiar with most common ones:
- Memory leaks: Unreleased memory leading to performance degradation or crashes.
- Heap corruption: Overwriting memory beyond allocated bounds, causing unpredictable behavior.
- Fragmentation: Inefficient memory usage due to scattered free blocks.
- Performance issues: Slow application due to excessive heap allocations or deallocations.
How does Heap Memory prevent Memory Leaks?
In image editing software, filters and effects often involve heavy image processing.
If intermediate results are not properly deallocated, they can accumulate in the heap, leading to a memory leak. Over time, the application might become sluggish or crash due to insufficient memory.
Understanding heap memory helps you as a developer identify and address such issues, ensuring the software’s stability.
How to reduce Security Vulnerabilities with Heap Memory?
Buffer overflows, a common security vulnerability, often exploit heap memory mismanagement.
This code is a simple memory leak scenario where allocated memory is not released:
#include <stdio.h>
#include <stdlib.h>

int main() {
    int *ptr = (int*)malloc(sizeof(int));
    // ... some code where ptr is used ...
    return 0; // Memory leak: ptr is not freed
}
If a program writes data beyond the allocated heap memory bounds, it can overwrite adjacent data, potentially corrupting program logic or even executing malicious code.
By practicing safe heap memory usage, developers can significantly reduce the risk of such attacks.
What are the Common Causes of Heap Corruption?
Heap corruption occurs when a program writes data to an incorrect memory location.
Common causes include buffer overflows, use-after-free errors, double-free errors, and invalid pointer dereferencing.
To prevent heap corruption, follow these guidelines:
- Conduct thorough input validation to prevent buffer overflows.
- Carefully manage memory allocation and deallocation to avoid use-after-free and double-free errors.
- Use debugging tools to detect memory errors early in development.
- Consider using smart pointers or garbage collection mechanisms to automate memory management.
How does heap memory management differ between Linux, Windows, and macOS?
Linux
- Flexible: Offers a high degree of control over heap management.
- Customizable: Allows for custom allocators to optimize performance.
- Efficient: Generally efficient due to its flexible approach.
Windows
- Structured: Provides a more rigid heap management system.
- Less flexible: Offers limited customization options compared to Linux.
- Performance-oriented: Often optimized for performance through default heap management.
macOS
- Balanced: Combines elements of both Linux and Windows.
- Moderate flexibility: Offers some customization options while maintaining a structured approach.
- Efficient: Provides generally efficient heap management.
Conclusion
This guide is a deep dive into Linux Process Heap Memory which can be helpful for beginners and advanced Linux users.
Check heap memory usage with /proc/<PID>/maps for a static view, top or htop for a general overview, valgrind for detailed profiling, or custom instrumentation for precise measurement.
Inefficient heap management can lead to frequent garbage collections, causing noticeable performance degradation and increased response times.