Linux Check Memory Usage
Monitoring memory usage is crucial for maintaining optimal system performance and troubleshooting issues.
By understanding memory metrics such as total, used, free, cached, and swap memory, you can identify potential bottlenecks, optimize resource allocation, and ensure system stability.
Here are the two methods of Linux Check Memory Usage:
- GUI: Using the GNOME-System-Monitor tool by accessing the System Monitor, and finding the Memory tab to observe the graphs under the Resources option.
- Command Line:
freeCommand: Provides a quick overview of memory usage.topCommand: Monitors memory usage, identify resource-intensive processes, and optimize system performance.htopCommand: Provides a real-time snapshot of a system’s resources, including memory usage.vmstatCommand: Provides insights into various system metrics, including memory usage.sarCommand: Gathers and reports system activity data, including memory usage./proc/meminfofile: Provides a detailed snapshot of your system’s memory usage.
Prerequisites to Check Memory Usage in Linux
Linux Check Memory Usage requires below specifications on your system:
- A Linux VPS plan running one of Linux distributions.
- A non-root user with
sudoprivileges.
Steps to Linux Check Memory Usage through GUI
Most Linux distributions include a system monitor tool for a visual overview of system resources. Linux Check Memory Usage using GUI requires the below steps:
Step 1: Access the System Monitor
On Ubuntu/Debian: Press the Super key (Windows key), type “System Monitor,” and press Enter.
On Fedora/RHEL/CentOS: Search for “System Monitor” in the applications menu.
On other distributions: Look for a system monitoring tool, or run the below command to launch the GNOME-System-Monitor:
$ sudo snap install gnome-system-monitorStep 2: Navigate to the Memory Tab
Once the System Monitor is open, find the “Memory” tab or a similar option that shows how much memory is being used by the active processes.
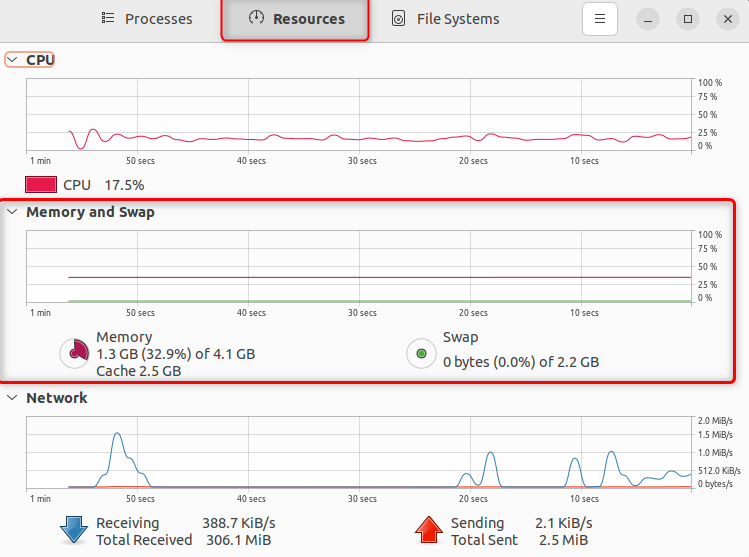
Let’s check the interpretation of the tabs you will face in Linux memory management:
Memory Usage: Typically displays total, used, free, and cached memory.
Swap Usage: Shows virtual memory utilization.
Process List: Often includes memory consumption per process.
Graphs: Visual representation of memory usage over time.
Using the graphs, you can check memory usage Linux.
How to Check Memory Usage in Linux Using Command Line
The command line provides precise and detailed information about memory usage to help monitor memory usage Linux.
Among all the Linux commands, 6 key commands enable you to check memory usage in Linux. Let’s dive into them:
1. free Command
This command provides a summary of total, used, free, shared, buffered, and cached memory to help for Linux memory usage:
freeUsing Options:
-h: Displays output in human-readable format (MB, GB).-m: Displays output in megabytes.-g: Displays output in gigabytes.
For example: Use the -h option for human-readable output in megabytes (MB) or gigabytes (GB).
free -hOutput:
 total        used        free      shared  buff/cache available
Mem:           9.6G       7.3G       2.3G          0       2.0G        2.3G
Swap:          2.0G         11M       2.0G
The available column is often more relevant than free as it indicates the amount of memory immediately available for use.
2. top Command
The top command displays real-time information about processes and system resources, including memory usage.
It offers detailed insights into memory consumption, including a breakdown by process:
topUsing Options:
- Press
Mto sort processes by memory usage. - Use the
-boption for batch mode output. - Press
hfor help on keyboard shortcuts. - Explore other options like
-dto set update interval.
For example:
top - 16:34:42 up 1 day, 19:20,  2 users,  load average: 0.00, 0.01, 0.05
Tasks: 126 total,   1 running, 124 sleeping,   0 stopped,   0 zombie
Cpu(s):  0.0%us,  0.0%sy,  0.0%ni, 99.9%id,  0.0%wa,  0.0%hi,  0.0%si,  0.0%st
Mem:   15743640k total, 1138696k used, 14604944k free,   104684k shared
Swap: 1998016k total,        0k used,  1998016k free
Understanding the Output:
- Top section: Provides overall system statistics, including memory usage (total, used, free, and buffers/cache).
- Process list: Displays running processes with their corresponding resource consumption, including memory usage (%MEM column).
- Sorting: Press
Mto sort processes by memory usage.
3. htop Command
The htop command is an enhanced version of top, offering a more user-friendly interface for monitoring system resources, including memory and CPU usage.
It provides real-time updates, process management tools, and a clearer visual representation of system health.
htopUsing Options:
htop -d 2: Sets the update interval to 2 seconds.htop -u deepak: Displays processes owned by the user “deepak”.htop -s 12345: Starts htop with a specific PID.
4. vmstat Command
This command provides statistics about virtual memory, paging, swapping, and CPU activity.
vmstatExample:
procs ----------- memory----------- swap---------- io------------ system------ cpu --------
 r  b   swpd   free   buff  cache  si   so   bi   bo   in   cs us sy id wa ir  st  tl
 2  0   112  31768  1204  54080   0    0   32  24   27  11  0  0 99  0  0  0
Understanding the Output:
The output typically contains several columns:
- procs: Information about running and waiting processes.
- memory: Details about physical and swap memory usage.
- swap: Swap in and swap out activity.
- io: Block input/output statistics.
- system: System calls and interrupts.
- cpu: CPU activity.
Using Options:
-s <delay>: Specifies the update interval in seconds:
vmstat 1This will display statistics every 1 seconds.
-S M: Displays output in megabytes instead of kilobytes:
vmstat -S MNotes:
- By combining
vmstatwith other tools likefreeandtop, you can gain a comprehensive understanding of your system’s memory behavior. - High
swpdvalues indicate excessive swapping, which can impact performance. - Low
freememory can lead to performance issues if applications demand more memory than available. buffandcachememory are generally used efficiently by the system.
5. sar Command
The sar (System Activity Reporter) command reports system activity and performance data, including memory usage.
sar -rThis command displays a single line of memory-related statistics.
Using Options:
-r <interval> <count>: Collects memory statistics every<interval>seconds for<count>times.
sar -r 1 5This command collects memory statistics every second for 5 times.
-B: Displays paging statistics (page in, page out).-W: Displays swapping statistics (swap in, swap out)
Example Output:
Linux 5.15.0-57-generic (localhost)  08/17/23        _x86_64_        (4 CPU)

10:00:01 PM     kbmemfree kbmeused  kbswapfree  kbswpused   kbbdirty  kbcached  kbcommit
10:00:02 PM     3188368  675844    1995604         0       3352   143876  1024680
Understanding the output:
- kbmemfree: Shows the amount of free physical memory.
- kbmeused: Indicates the amount of used physical memory.
- kbswapfree: Represents the free swap space.
- kbswpused: Shows the used swap space.
- kbcached: Represents the amount of memory used as cache.
Notes:
- Combine
sarwith other tools likefreeandtopfor a comprehensive understanding of memory behavior. - Use appropriate options to tailor the output to your specific needs.
6. /proc/meminfo file
The /proc/meminfo file contains detailed memory information in a human-readable format. It’s a virtual file in the /proc filesystem that contains various memory-related statistics.
cat /proc/meminfoThis command displays the contents of the /proc/meminfo file.
Key fields:
MemTotal: Total physical memory.
MemFree: Free physical memory.
MemAvailable: Amount of memory available for immediate allocation.
Buffers: Memory used as buffers for I/O operations.
Cached: Memory used as cache for file system data.
SwapTotal: Total swap space.
SwapFree: Free swap space.
Example Output:
MemTotal:       8157632 kB
MemFree:        401504 kB
MemAvailable:  1432072 kB
Buffers:        12764 kB
Cached:        301268 kB
SwapCached:      1332 kB
Active:        301140 kB
Inactive:       703520 kB
Active(anon):   148564 kB
Inactive(anon): 555004 kB
...Notes:
- Use grep or awk to extract specific information from
/proc/meminfo:
# Total and free memory
cat /proc/meminfo | grep -E "MemTotal|MemFree"- You can use cat or
lesscommands to view the contents.
Your’e all done! Now, you know how to check memory usage in Linux using the above commands.
How to Understand the Output of Linux Check Memory Usage?
Here is the interpretation of the Outputs:
Total memory: The total amount of physical RAM installed.
Used memory: Memory currently allocated to processes and kernel data structures.
Free memory: Unused physical memory.
Buffered/Cached: Memory used to store data for disk read/write operations.
Swap: Virtual memory used when physical memory is full.
What is swap memory and why is it important?
Swap memory is virtual memory used when physical memory is full. It’s slower than RAM, so excessive swapping can impact performance.
Why Checking Memory Usage in Linux Matters?
Checking memory usage in Linux is crucial for maintaining system performance, troubleshooting issues, and optimizing resource allocation.
Insufficient memory can lead to system slowdowns, application crashes, and even system instability.
By monitoring memory usage, you can:
- Identify memory leaks: Pinpoint applications consuming excessive memory.
- Optimize system performance: Adjust resource allocation based on usage patterns.
- Troubleshoot issues: Determine if memory-related problems are causing system instability.
- Plan for future hardware upgrades: Estimate future memory requirements based on current usage.
How to identify which process is using the most memory?
Use top or htop to sort processes by memory usage (usually the “RES” or “MEM” column).
How to free up memory in Linux?
Close unnecessary applications, clear browser cache, and consider increasing swap space if needed.
For more drastic measures, use kill or killall to terminate processes with caution.
Conclusion
This tutorial covered two methods to help Linux users check memory usage. As a Linux system administrator or performance tuner, you should monitor memory usage regularly.
According to your preferences, you can use one of the GUI or Command Line solutions for Linux system monitor.
To delve deeper into process-specific memory usage, refer to our article on How to Check Heap Memory Usage of a process in Linux.