Top 12 Server Monitoring Tools
Server monitoring tools are essential for tracking performance, detecting issues, and ensuring system stability across Linux and Windows environments.
Leading solutions like Zabbix, Nagios, and SolarWinds help businesses maintain uptime and security. Investing in a VPS Server is the right choice for scalable, high-performance hosting and full control.
This article will cover the top 12 server monitoring tools available for Windows and Linux, assisting administrators in making decisions for optimal server management.
Top 12 Server Monitoring Tools for Windows & Linux (2026)
To keep your infrastructure running at peak efficiency, choosing the right server monitoring tools for Windows and Linux is essential.
This list of the best server monitoring tools will help you find the perfect solution for stability, security, and performance
1. Zabbix
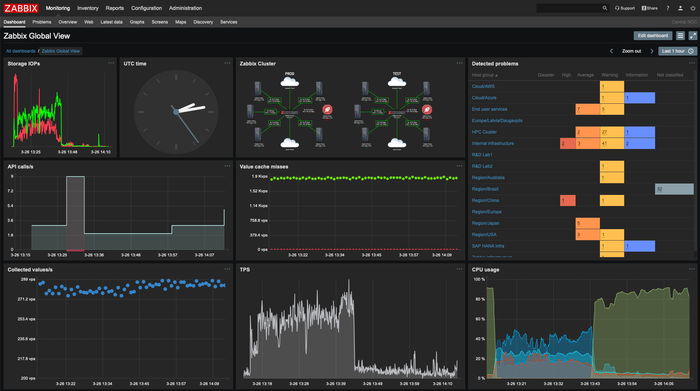
Zabbix is one of the best server monitoring tools, offering a powerful and flexible solution for tracking real-time performance across large-scale infrastructures.
This open-source server monitoring tool provides deep visibility into networks, cloud environments, and physical or virtual servers, ensuring complete control over system health.
With its advanced alerting system, users can set up custom triggers to detect anomalies before they escalate, making it one of the top 12 server monitoring tools trusted by enterprises.
Whether you’re managing a Linux-based environment or need a reliable server performance monitoring tool for Windows, Zabbix excels in automation and predictive analytics.
Our step-by-step guide on installing Zabbix On CentOS 8 And RHEL 8 ensures a smooth setup process for those looking to deploy Zabbix on Linux.
Its extensive integrations and free server monitoring tools capabilities make it an excellent choice for businesses seeking proactive monitoring without expensive licensing costs.
Zabbix Key Features
Comprehensive System Monitoring
Zabbix provides server performance monitoring tools for Windows and Linux, tracking CPU usage, memory, disk space, and network traffic in real time.
Advanced Alerting & Automation
With custom triggers and automated remediation, Zabbix helps IT teams resolve issues before they impact uptime.
Flexible Integrations
It seamlessly connects with third-party tools like Grafana, Prometheus, and cloud-based services, enhancing monitoring capabilities.
Zabbix Pros & Cons
✅ Pros: Free and open-source, scalable, strong community support.
❌ Cons: Can be complex to set up and configure for beginners.
Zabbix Ideal Use Case
Best suited for enterprises and IT professionals looking for a scalable, open-source server monitoring tool with in-depth analytics.
Zabbix Pricing
- Completely free (open-source)
- Paid enterprise support plans are available.
Zabbix Reviews
As an open-source powerhouse for scalable monitoring, Zabbix is a top choice for those seeking a highly customizable and powerful server monitor tool.
Despite a steep learning curve, its advanced features make it one of the best server monitoring tools in 2026.
2. Nagios
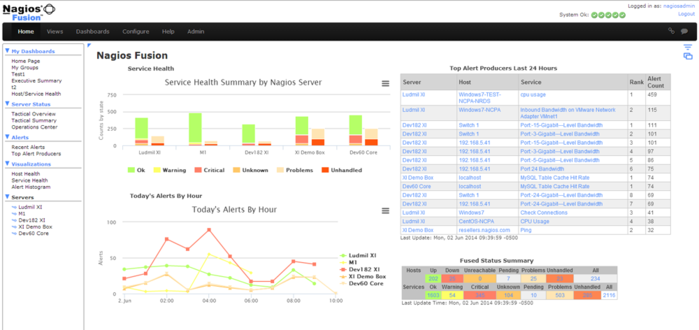
Nagios is a leading server monitoring tool designed to detect and resolve performance issues across IT infrastructures.
As one of the best server monitoring tools, it provides real-time monitoring, proactive alerts, and detailed reports on server health. This open-source server monitoring tool supports Linux and Windows, offering flexibility for diverse environments.
With its plugin-based architecture, it expands server monitoring tools possibilities, making it ideal for custom integrations.
Businesses looking for free server monitoring tools for Windows or Linux can rely on Nagios for efficient resource tracking and downtime prevention.
Nagios Key Features
Multi-Platform Monitoring
Nagios is one of the few server monitoring tools for Windows and Linux that supports the monitoring of servers, networks, and cloud applications from a centralized dashboard.
Extensive Plugin Library
With over 5,000 plugins, Nagios offers customizable monitoring solutions for different server types and configurations.
Automated Incident Response
Configurable alerts allow for automated responses to performance degradation, reducing downtime risks.
Nagios Pros & Cons
✅ Pros: Highly customizable, strong community support, enterprise-ready.
❌ Cons: Steep learning curve, requires configuration expertise.
Nagios Ideal Use Case
Great for large enterprises and IT professionals who need detailed system monitoring with a vast plugin ecosystem.
Nagios Pricing
- Free monitoring tools for servers (Nagios Core)
- Paid versions (Nagios XI with advanced features)
Nagios Reviews
As an enterprise-grade server monitoring for Windows & Linux, Nagios is one of the best server monitoring tools, offering flexibility and deep monitoring insights.
Its extensive plugin support makes it a powerful choice for complex IT infrastructures.
3. Opsview
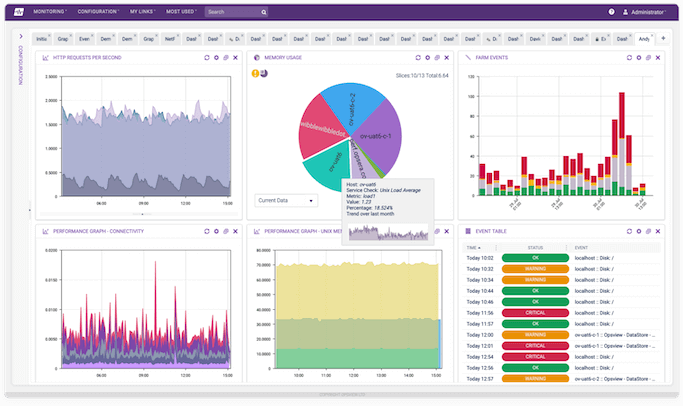
Opsview is a powerful server monitoring tool designed to provide complete visibility into IT infrastructure across hybrid cloud environments.
As one of the best server monitoring tools, it offers automated discovery, performance tracking, and predictive analytics, helping administrators detect and resolve issues before they impact operations.
Supporting both server monitoring tools for Windows and server monitoring tools for Linux, Opsview delivers deep insights into server health, network performance, and application dependencies
Its scalability makes it ideal for enterprises that need advanced tools for server monitoring to manage thousands of devices efficiently.
Whether for on-premises or cloud environments, Opsview ensures smooth IT operations with proactive monitoring capabilities.
Opsview Key Features
Hybrid Infrastructure Support
Monitors both on-premises and cloud-based environments with unified dashboards.
Automated Reporting & Alerts
Provides real-time alerts and historical performance analytics for proactive issue resolution.
Scalability & Customization
Designed for large enterprises, Opsview scales efficiently with growing IT demands.
Opsview Pros & Cons
✅ Pros: Enterprise-grade monitoring, hybrid support, scalable.
❌ Cons: Requires configuration expertise, paid plans only.
Opsview Ideal Use Case
Great for large enterprises looking for a scalable and centralized server monitoring tool.
Opsview Pricing
- Subscription-based with flexible pricing models.
Opsview Reviews
As a unified server monitoring for hybrid IT environments, Opsview stands out among the best server monitoring tools, offering comprehensive monitoring for hybrid IT infrastructures.
4. Zenoss
Zenoss is a comprehensive server monitoring tool that excels in hybrid IT infrastructure monitoring.
With its ability to track real-time performance metrics and detect anomalies, it stands out in the list of server monitoring tools for businesses needing full-stack observability.
This open-source server monitoring tool leverages AI-driven analytics to predict and prevent downtime, ensuring optimal performance. It integrates seamlessly with cloud platforms, making it one of the modern enterprise’s best server monitoring tools.
With extensive support for server monitoring tools for Windows and Linux, Zenoss simplifies IT management while offering deep-rooted automation and intelligent event correlation.

Zenoss Key Features
AI-Driven Monitoring
Zenoss leverages machine learning and AI to analyze system health, detect anomalies, and predict failures.
Scalable Multi-Cloud Support
It supports on-premises, cloud, and hybrid infrastructures, making it one of the best server monitoring tools for large enterprises.
Automated Alerts & Reporting
With intelligent alerting and detailed reporting, IT teams can track and resolve issues efficiently.
Zenoss Pros & Cons
✅ Pros: AI-powered insights, excellent cloud support, scalable.
❌ Cons: Enterprise-focused, requires a paid subscription.
Zenoss Ideal Use Case
Best suited for enterprises that need AI-enhanced server monitoring tools for Windows and Linux.
Zenoss Pricing
- Subscription-based enterprise pricing with custom plans.
Zenoss Reviews
As an AI-powered IT monitoring tool for Windows & Linux, Zenoss stands out in the list of server monitoring tools, offering predictive monitoring and AI-powered automation for modern IT environments.
5. ManageEngine Free Windows Admin Tools
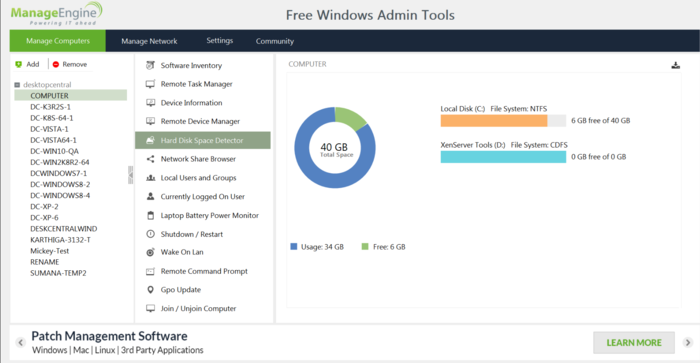
ManageEngine’s free monitoring tools for servers provide a suite of utilities tailored for Windows-based IT environments.
This collection of server performance monitoring tools for Windows helps administrators oversee CPU usage, disk space, services, and event logs with ease. For advanced monitoring with more control, consider upgrading to a powerful Windows VPS.
As part of the top 12 server monitoring tools, these lightweight yet efficient utilities enable quick diagnostics and troubleshooting.
Their user-friendly interface and instant alerts make them essential server monitoring tools for Windows administrators.
For those looking for free server monitoring tools Windows without complex setups, ManageEngine delivers reliable performance and easy deployment.
ManageEngine Key Features
Windows-Specific Server Monitoring
Tracks disk usage, CPU load, event logs, and network performance for Windows environments.
User-Friendly Interface
Offers a simple yet effective dashboard for monitoring essential server metrics.
Completely Free
One of the few free server monitoring tools for Windows, making it ideal for small businesses and startups.
ManageEngine Pros & Cons
✅ Pros: Free to use, easy setup, lightweight.
❌ Cons: Limited features, not suitable for large-scale environments.
ManageEngine Ideal Use Case
Best for small businesses or Windows server administrators looking for basic free monitoring tools for servers.
ManageEngine Pricing
- 100% Free.
ManageEngine Reviews
As a dedicated Windows monitoring suite, this tool is perfect for businesses seeking free server monitoring tools for Windows.
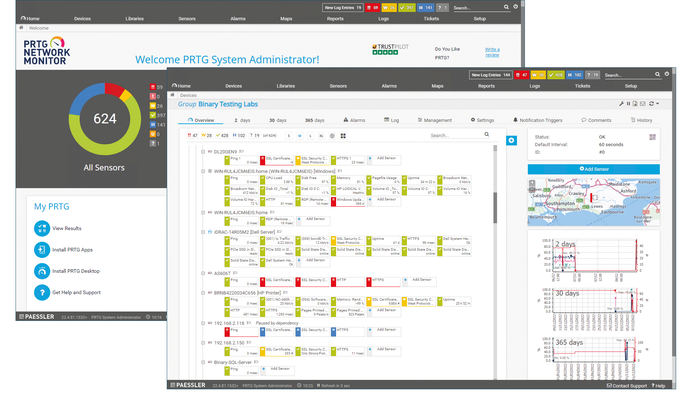
6. Paessler PRTG Network Monitor
PRTG Network Monitor is one of the most versatile server monitor tools, offering all-in-one monitoring for networks, servers, and applications.
Its customizable sensors provide real-time insights into system health, making it a standout in the list of server monitoring tools for enterprises of all sizes.
With support for server monitoring tools for Windows and Linux, it ensures cross-platform compatibility while enabling remote monitoring through mobile apps.
PRTG’s intuitive dashboard, combined with automated alerts, makes it one of the best server monitoring tools for proactive IT management.
Whether for small businesses or large data centers, this server monitoring tool enhances operational efficiency and reduces downtime.
Paessler PRTG Key Features
All-in-One Network & Server Monitoring
PRTG monitors servers, networks, bandwidth, and applications from a unified dashboard.
Customizable Alerts & Dashboards
Provides real-time alerts and customizable dashboards for quick issue resolution.
Auto-Discovery & Easy Setup
Automatically detects network devices, making it easy to deploy in enterprise environments.
Paessler PRTG Pros & Cons
✅ Pros: Highly detailed monitoring, customizable, great for network admins.
❌ Cons: Windows-focused, pricing can be high for large-scale use.
Paessler PRTG Ideal Use Case
Ideal for Windows server administrators who need a comprehensive monitoring solution for their infrastructure.
Paessler PRTG Pricing
- Free version available (limited sensors)
- Paid plans for enterprise users.
Paessler PRTG Reviews
As a comprehensive Windows Server Monitoring PRTG, it is one of the best server monitoring tools for Windows users looking for an all-in-one monitoring solution.
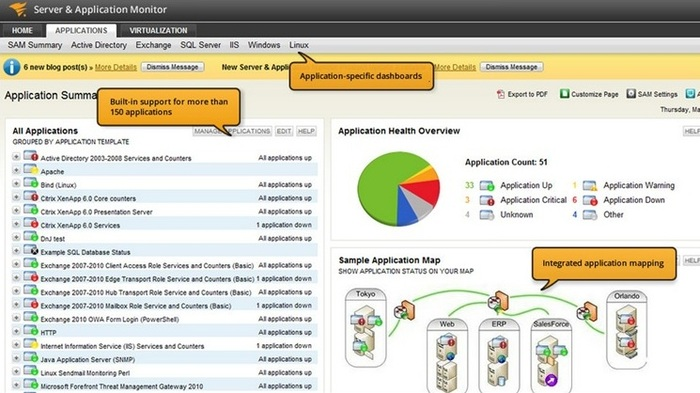
7. SolarWinds Server & Application Monitor
SolarWinds is a highly trusted server monitoring tool known for its deep application monitoring and infrastructure management features.
It provides end-to-end visibility into both cloud and on-premises environments, ranking among the top 12 server monitoring tools for enterprises.
Supporting both server monitoring tools for Windows and Linux, it continuously tracks CPU, memory, disk usage, and application performance.
With robust automation and intelligent alerting, SolarWinds simplifies issue resolution, making it one of the best server monitoring tools for optimizing IT performance.
Its extensive integrations and easy scalability make it a go-to choice for administrators managing large infrastructures.
SolarWinds Server & Application Monitor Key Features
Windows-Centric Monitoring
Offers detailed monitoring for Windows server performance, applications, and cloud services.
Customizable Alerts & Automation
Automated alerting and remediation ensure quick issue resolution before downtime occurs.
Enterprise-Ready & Scalable
Designed for large-scale Windows deployments, making it a favorite among enterprise IT teams.
SolarWinds Server & Application Monitor Pros & Cons
✅ Pros: Enterprise-grade monitoring, feature-rich, automation capabilities.
❌ Cons: Expensive for small businesses, Windows-focused.
SolarWinds Server & Application Monitor Ideal Use Case
Best for enterprise IT teams managing large-scale Windows server infrastructures.
SolarWinds Server & Application Monitor Pricing
- Paid plans with free trials available
SolarWinds Server & Application Monitor Reviews
As an enterprise-grade Windows Monitoring tool for businesses that rely on Windows servers, SolarWinds SAM is one of the best server monitoring tools available in 2026.
8. ManageEngine OpManager
OpManager by ManageEngine is an advanced server monitoring tool built for real-time network and server performance tracking.
It provides deep insights into system health, making it a key player in the list of server monitoring tools for businesses. Supporting both server monitoring tools for Windows and Linux, it enables centralized management of IT resources with AI-powered alerts.
Its ability to monitor bandwidth, applications, and hardware health makes it one of the best server monitoring tools available.
Whether used for small IT setups or enterprise-level monitoring, OpManager ensures proactive issue resolution with its highly customizable dashboard.

ManageEngine OpManager Key Features
Real-Time Server Health Monitoring
OpManager continuously tracks CPU usage, memory performance, disk space, and network traffic, ensuring optimal system performance.
Automated Alerting & Reporting
With intelligent alerts, customizable reports, and detailed performance insights, IT admins can quickly diagnose server issues before they cause downtime.
Scalability for Large Deployments
Supports multi-server environments, making it an ideal choice for enterprise networks and data centers.
ManageEngine OpManager Pros & Cons
✅ Pros: Comprehensive monitoring, automation features, intuitive dashboard.
❌ Cons: Paid plans are required for advanced capabilities.
ManageEngine OpManager Ideal Use Case
Best for businesses that need centralized monitoring for multiple Windows servers.
ManageEngine OpManager Pricing
- Paid Plans Available.
ManageEngine OpManager Review
ManageEngine OpManager is one of the best server monitoring tools for Windows, providing deep insights and real-time analytics for seamless server performance monitoring.
9. Netstat
Netstat is a command-line server monitoring tool that helps administrators analyze network connections and detect potential security threats.
It’s a must-have for IT professionals diagnosing network-related issues. Pairing it with a reliable Linux VPS can further enhance monitoring capabilities.
As part of the list of server monitoring tools, it provides real-time data on active connections, routing tables, and protocol statistics.
This tool is essential for troubleshooting network performance, particularly for server monitoring tools for Linux and Windows environments.
Being lightweight and built into most operating systems, Netstat is one of the most accessible free monitoring tools for servers for diagnosing network congestion and unauthorized access attempts.
Netstat Key Features
Real-Time Network Traffic Analysis
Netstat helps monitor incoming and outgoing connections, allowing admins to detect unauthorized access attempts or bottlenecks.
Lightweight & Built-In
Since Netstat is pre-installed on most Linux distributions, it requires no additional setup or resource consumption.
Detailed Connection Insights
Track protocol usage (TCP, UDP), active connections, and listening ports for better security and traffic management.
Netstat Pros & Cons
✅ Pros: Free, built-in, and lightweight.
❌ Cons: No graphical interface, requires command-line knowledge.
Netstat Ideal Use Case
Best for Linux system administrators who need on-the-fly network analysis without third-party tools.
To use the Netstat network tool on Linux, simply launch the Terminal. It’s one of the essential commands for checking open ports in Linux.
Netstat Pricing
- Completely Free.
Netstat Reviews
Netstat is among the most essential free server monitoring tools, offering real-time insights into Linux network performance without additional software.
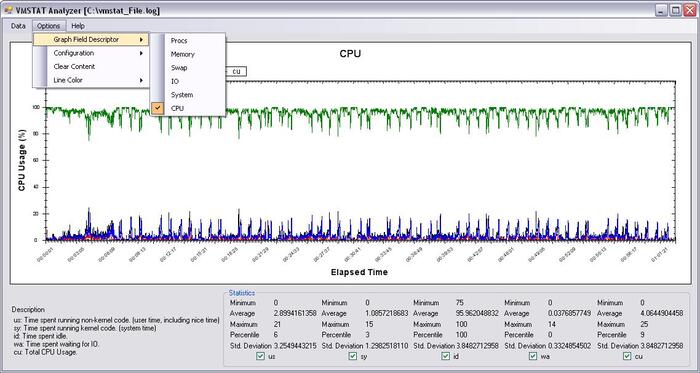
10. Vmstat
Vmstat is a lightweight server monitor tool that provides real-time system performance metrics, including CPU, memory, and process management insights.
As an essential part of open-source server monitoring tools, it helps administrators optimize system efficiency by analyzing workload distribution.
Vmstat supports server monitoring tools for Linux, making it an indispensable utility for performance tuning and diagnosing bottlenecks.
Included in the list of server monitoring tools, it offers a quick and effective way to monitor resource utilization, ensuring system stability and efficiency.
Vmstat Key Features
Instant System Performance Reports
Vmstat helps analyze CPU load, memory usage, and disk activity for performance optimization.
No Installation Required
It comes pre-installed on most Linux distributions, making it a lightweight and efficient monitoring solution.
Ideal for Troubleshooting
IT admins use Vmstat for diagnosing server slowdowns, memory bottlenecks, and process overloads.
Vmstat Pros & Cons
✅ Pros: Free, built-in, lightweight, and effective.
❌ Cons: No real-time alerting or historical logging.
Vmstat Ideal Use Case
Perfect for quick system analysis on Linux servers without resource-heavy monitoring solutions.
Vmstat Pricing
- Completely Free.
Vmstat Reviews
As a lightweight Linux performance Monitoring tool, Vmstat remains one of the best open-source server monitoring tools for Linux, offering real-time performance insights with minimal system impact.
11. Checkmk
Checkmk is a powerful open-source server monitoring tool designed for high-performance IT environments.
Known for its modular approach, it allows deep system monitoring with minimal resource consumption, ranking among the top 12 server monitoring tools for enterprises.
Supporting both server monitoring tools for Windows and Linux, it provides automated discovery, intelligent alerts, and real-time reporting.
Its flexibility and scalability make it one of the best server monitoring tools for businesses seeking a cost-effective and robust monitoring solution.
With its extensive plugin support, Checkmk adapts to various IT infrastructures, offering unparalleled monitoring possibilities.

Checkmk Key Features
Auto-Discovery of Network & Server Components
Checkmk automatically detects new servers, devices, and services, reducing manual configuration time.
Comprehensive Performance Monitoring
From CPU, memory, and disk usage to application health and process monitoring, Checkmk provides detailed insights.
Customizable Alerting System
Set up threshold-based alerts for proactive incident management and system optimization.
Checkmk Pros & Cons
✅ Pros: Open-source, scalable, automation-friendly.
❌ Cons: The free version lacks some enterprise features.
Checkmk Ideal Use Case
Best for admins looking for open-source, scalable monitoring for hybrid environments.
Checkmk Pricing
- Free & Paid Plans Available.
Checkmk Reviews
As an enterprise-grade open-source Monitoring tool, Checkmk is one of the top free server monitoring tools, offering scalability and flexibility for enterprise IT teams.
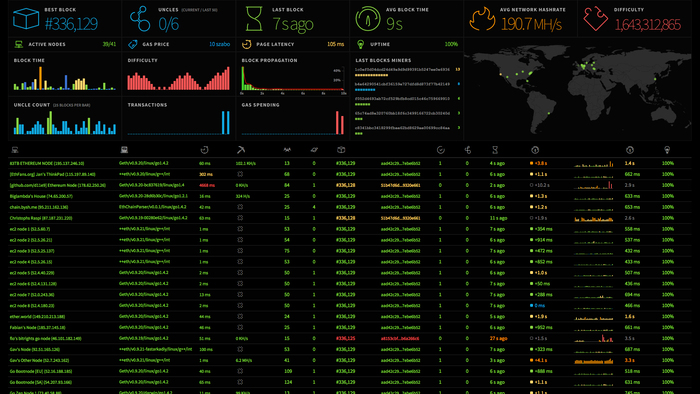
12. Prometheus
Prometheus is an industry-leading open-source server monitoring tool built for dynamic and scalable infrastructures.
As one of the best server monitoring tools, it excels in time-series data collection, making it ideal for cloud environments and microservices architectures.
Supporting both server monitoring tools for Linux and Windows, it offers real-time metric tracking with powerful query capabilities.
Prometheus’s flexible alerting system ensures that IT teams receive instant notifications for performance anomalies.
Included in the list of server monitoring tools, it integrates seamlessly with Grafana for advanced visualization, making it a top choice for modern DevOps teams.

Prometheus Key Features
Time-Series Data Collection
Prometheus excels at capturing real-time server performance metrics and storing them as time-series data for historical analysis.
Powerful Query Language (PromQL)
Admins can write custom queries to analyze and visualize system performance trends.
Dynamic Alerting & Integration
Prometheus integrates with Grafana and other monitoring solutions, offering custom alerting for system failures.
Prometheus Pros & Cons
✅ Pros: Open-source, scalable, ideal for modern infrastructure.
❌ Cons: Requires setup and knowledge of PromQL.
Prometheus Ideal Use Case
Best for developers and IT teams needing real-time Linux server monitoring with cloud integration.
Prometheus Pricing
- Completely Free & Open Source.
Prometheus Reviews
Prometheus is one of the best open-source server monitoring tools, providing highly flexible, cloud-ready monitoring for Linux environments.
To check more advanced solutions, check out the Best Linux Network Monitoring Tools guide.
Key Considerations When Choosing Server Monitoring Tools
Selecting the best server monitoring tools requires evaluating factors like real-time monitoring capabilities, scalability, alerting system, and ease of integration.
A robust server monitoring tool should provide detailed performance insights, proactive issue detection, and compatibility with Linux and Windows environments.
For businesses prioritizing cost-effectiveness, free server monitoring tools or open-source server monitoring tools like Zabbix or Prometheus offer flexible, budget-friendly solutions.
Meanwhile, enterprise-grade server performance monitoring tools for Windows such as SolarWinds deliver comprehensive analytics with automation features.
Consider whether you need on-premise or cloud-based monitoring, and ensure that the tool supports custom metrics, security monitoring, and intuitive reporting for seamless IT infrastructure management.
How to Use Server Monitoring Tools Effectively?
Using server monitoring tools depends on the complexity of the tool and the user’s expertise.
For beginners, many server monitoring tools for Windows and Linux offer preconfigured dashboards, automated alerts, and easy-to-use interfaces to track performance with minimal setup.
Tools like Paessler PRTG and SolarWinds provide step-by-step installation and predefined monitoring templates.
For advanced users, open-source server monitoring tools like Prometheus or Zabbix allow for custom configurations, metric tuning, and integration with visualization platforms like Grafana.
Experts can set up custom alert thresholds, automate responses, and optimize performance monitoring at a deeper level.
Regardless of skill level, choosing the right server monitor tools ensures real-time insights, security tracking, and seamless system management for Linux and Windows servers.
Conclusion
In this guide, we explored the top 12 server monitoring tools, analyzing their features, use cases, and benefits for both Windows and Linux servers.
From free server monitoring tools like Prometheus and Checkmk to enterprise-grade solutions such as SolarWinds and ManageEngine OpManager, each tool offers unique capabilities tailored to different infrastructure needs.
Implementing a server monitoring tool is crucial for maintaining system stability, performance optimization, and security preventing downtime, and ensuring seamless operations.
Whether you need open-source server monitoring tools for flexibility or Windows performance monitoring with automation, the right choice ensures proactive management and real-time issue detection.