Mikrotik Traceroute Command
Let’s start another tutorial and get familiar with a troubleshooting tool. Traceroute is a command line tool that enables you to troubleshoot network connectivity issues. Mikrotik traceroute command uses echo packets to trace the route. You can use the traceroute command to monitor the way that packets take to the endpoint packets path, and where these hops are disconnected. In this way, you will receive a list of the routers that the packet travels through to get to a remote host.
On almost every Unix-like operating system, the traceroute or tracepath utility is accessible, while tracert is also available on Microsoft Windows operating systems. Understanding traceroute command in Mikrotik is not that difficult and this guide helps you to learn How to Use Mikrotik Command to troubleshoot network issues.
You might be one of the various users who buy the Mikrotik Virtual Server for the purpose of using it as a router. This tutorial helps you to learn how to use Traceroute in your Mikrotik Router. But first, let’s see what is Traceroute in simple words.
What is Traceroute and How Does it Work?
Mikrotik Traceroute Command is a useful tool that is designed to find the slowest hops in your network and troubleshoot network connectivity issues and sluggish network connections. Using this tool, you can identify where packets may fail or move slowly via the network. Using this data, you can identify the computer, router, switch, or other network device that might be the source of network problems or failure. It is more difficult to locate potential slowdown locations the more convoluted the path a network packet must travel to get to its destination.
The traceroute command sends out UDP probe packets with a time-to-live in an effort to track the path an IP packet takes to reach an Internet host. These messages appear to be the same, yet they are not. They have various TTLs. The TTL value is initially set to 1 by traceroute. When the next router discovers a packet with TTL = 1, it sets the TTL value to zero and sends an ICMP “time exceeded” message to the source. The source is informed by this message that the packet used that specific router as a hop. The TTL value is increased by 1 the following time, and so forth.
The TTL field is typically decreased by one unit by each router along the way to the destination until it reaches zero. User Datagram Protocol (UDP) packets are sent via the traceroute protocol, which is part of the TCP/IP family. The Time to Live (TTL) field in the header holds an eight-bit integer value. Contrary to what the name might imply, it represents a count rather than a duration.
When to Use Traceroute Command in Mikrotik
When you need to troubleshoot network connectivity difficulties and find unconnected hops and determine a packet’s path, traceroute is there as a helpful command line. The hops, or the path that packets traverse to reach the terminal, are checked using this program. So, you will be able to find unconnected hops and determine a packet’s path with the aid of the traceroute.
Using the traceroute command from Mikrotik would be like this:
[admin@MikroTik] > tool traceroute 10.255.255.1
     ADDRESS                                    STATUS
   1       10.0.1.17 2ms 1ms 1ms
   2    10.255.255.1 5ms 1ms 1ms
[admin@MikroTik] >
Now that you got familiar with Mikrotik Traceroute Command, you are ready to learn to use it on Mikrotik.
How to Use Mikrotik Traceroute Command
Let’s get started learning how to use Traceroute Command in Mikrotik to figure out the packets’ route and find the unconnected hops. Previously, you learned All about Winbox. Here, you need to work with the Winbox tool to connect to the router. Follow the below-required steps to get ready to troubleshoot network issues.
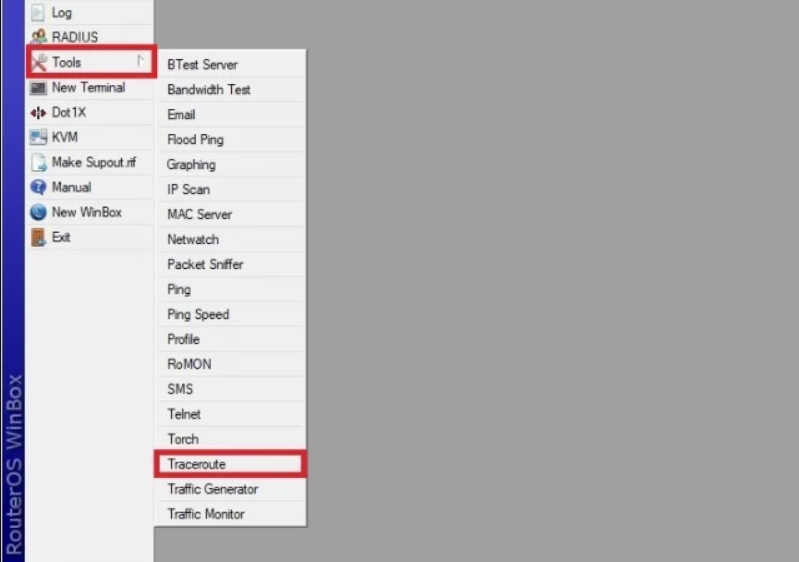
1. Using the Winbox utility, connect to the router.
2. From the “Tools” menu, select “Traceroute”.
If you prefer working on your Terminal, run the command below to open the “Traceroute” option in the system.
/tool traceroute3. A new window with editable tracing management parameters will appear if you choose the “Traceroute” option in the system. So, the following table shows the list of changeable options provided:
| Traceroute Option | Description |
| Traceroute To | You must provide the IP address of the location you want to track. |
| Packet Size | This term refers to the size of packets sent to hops. |
| TimeOut | This parameter is used to specify the response waiting timeout (i.e., the interval between messages). |
| Protocol | In this section, you can set ICMP and UDP. |
| Port | In this case, using the UDP protocol causes the port to be manually defined. |
| Use DNS | This function determines whether to utilize a DNS server (no by default). |
| Count | This number reflects how many packets there are to send. |
| Max Hops | The maximum number of hops is indicated by the term "Max Hops." |
| Src.Address | It is for Changing the package's source address. |
| Interface | In this option, you can choose the tracing interface to utilize. |
| Routing table | You can choose one of the routing tables in this option. |
4. Now, take the situation where the destination IP (ex: 8.8.8.8) must be entered in the “Traceroute To” box.
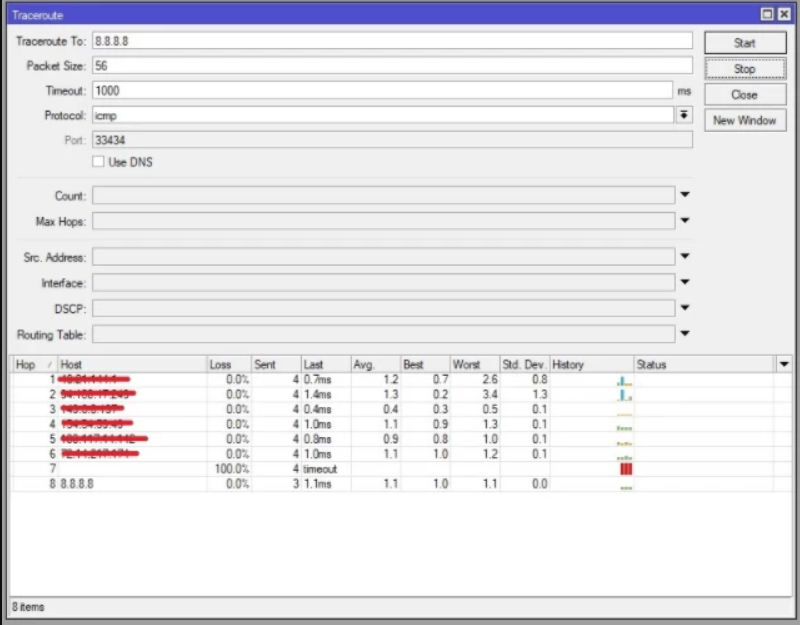
5. Fill in all the necessary information after providing the IP, so in this example, we used the values 56 for the packet size, 1000 for the timeOut, ICMP for the protocol, and 33434 for the port.
Note:
- The default for most traceroute’s probe packets is UDP with a destination port in the 33434–33534 range.
- listening for gateways along the way to respond with ICMP TIME_EXCEEDED.Max_ttl values for probes begin at one hop and are increased by one hop at a time.
6. After filling out all the necessary information, click Start to launch the MikroTik Traceroute.
7. You will receive the required findings from MikroTik after the system terminates the operation.
That’s it. Mikrotik Traceroute Command was all you learned. As you reviewed, the traceroute on MikroTik is not that complicated. Now, you are ready to start checking hops on your Mikrotik and check and view the communication link between a source host and a destination host or network.
How to Read Mikrotik Traceroute Command Output?
When you run a Mikrotik traceroute command, the following information appears in the first line:
- The destination and its IP address.
- The number of hops traceroute will try.
- The size of the UDP packets you are sending.
A Quick Way to Get Command Output From Mikrotik
There is another way to use Mikrotik Traceroute Command and get output from Mikrotik. Then, you will have a script to run the traceroute with the source address per hour. This quick method is to use SSH. You can use ssh to Mikrotik devices from Linux or Cygwin and redirect the output to a file.
Just run the command below from corn:
ssh [email protected] ':put "$[/system clock get time], $[/system clock get date]";/tool traceroute address=8.8.8.8' >> mikrotik-log.txtThis will add the entire output of the Mikrotik instructions to the file mikrotik-log.txt. Before the traceroute output, the first put will return the time and date. Consider avoiding using traceroute in unattended operations or scripts. The load that the traceroute can put on a network might have a negative effect on how well it performs.
FAQ
What is Hop Number?
The number of the hop along the route is listed in the first column.
Which ports am I required to use for traceroute?
It begins its probes with a time-to-live (TTL)of one and increases by one until it either reaches a maximum of 30 hops or receives an ICMP "port unreachable'' message. UDP port 33434 will be used by Traceroute to launch its probe.
Conclusion
In this article, Mikrotik Traceroute Command was introduced, and you learned how to traceroute on MikroTik to troubleshoot network issues. If you follow the above steps properly then you can smoothly traceroute on MikroTik but do not hesitate to contact us if you encounter any problems. Our technical support team will try their best to solve your problems.